


📊 Gloucester Township, NJ Real Estate Market Report: Nov 3 – Nov 9, 2024 🏡
Market Snapshot
Gloucester Township’s real estate market saw a dynamic week with notable activity in listings, pending properties, and sales prices. Here’s a detailed overview for buyers, sellers, and investors looking to stay informed and make the most of current market trends in this Southern New Jersey community. 📈🌆
📅 Active Listings
- Active Listings: 78 homes 🏠
- Average Listing Price: $364,774 💵
- Total Market Volume (Active Listings): $24,454,864 📉
Gloucester Township currently has a solid inventory with 78 active listings on the market. This volume provides a variety of options for prospective buyers, especially considering the competitive average price point. The total value of these homes showcases a strong real estate presence.
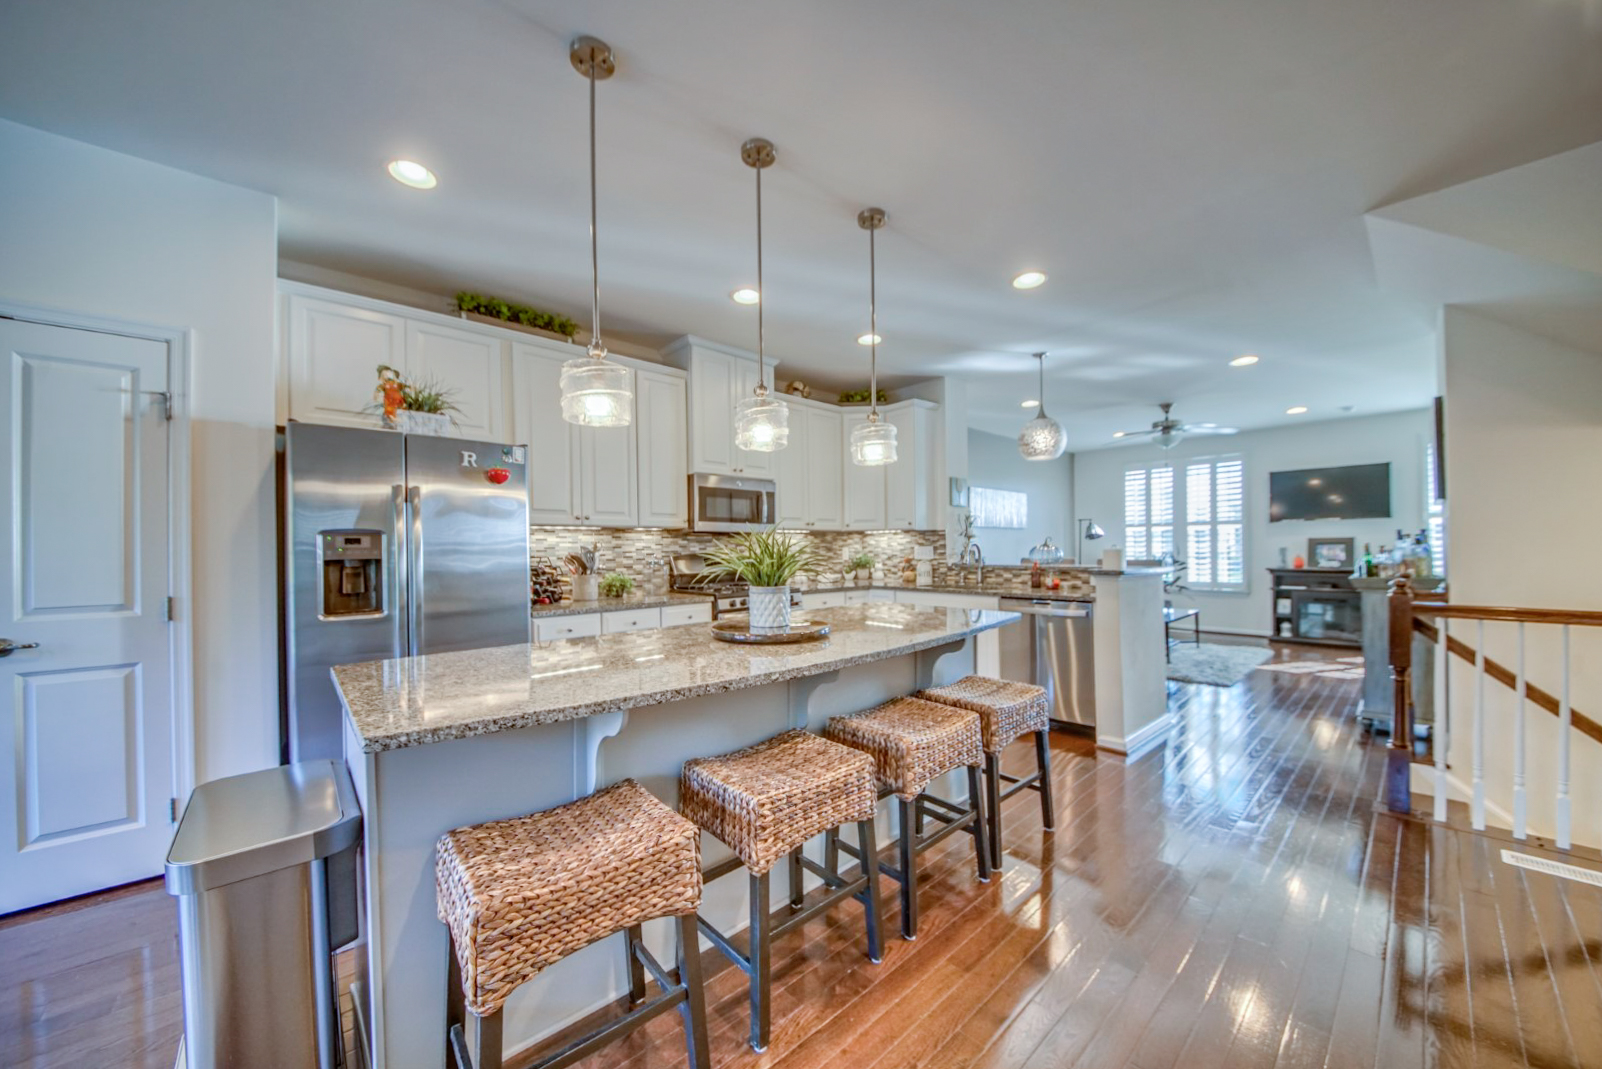
🏡 Coming Soon!
- Coming Soon Properties to Gloucester Twp!: 3 🔜
In anticipation of the next market cycle, three new listings are preparing to hit the market soon. These properties may increase options for buyers and impact competitive pricing as demand continues to evolve.
🔄 Pending Sales
- Pending Homes: 4
- Average Pending Price: $390,000 📊
Pending sales are showing a significant increase in price, with an average pending price of $390,000, indicating a strong buyer interest in the higher price range. This could suggest that sellers are achieving prices above recent averages, positioning Gloucester Township as a desirable locale.
📈 Settled Sales Last Week
- Homes Sold: 10 🏘️ (up significantly from previous weeks)
- Average Sold Price: $408,500 ⬇️ (a dip from last week)
- Total Sales Volume (Settled): $4,063,500 📊
With 10 homes closing last week, the average sold price was down slightly, settling at $408,500. This dip might signal some price adjustments in response to the supply and demand dynamic, as well as buyer preferences.
📏 Price Per Square Foot
- Average Price Per Sq. Ft.: $204.15 🏷️ (down from previous week)
The average price per square foot has seen a decrease, landing at $204.15. For buyers, this trend might indicate better value opportunities in the area. Sellers should consider this when setting or adjusting their listing prices.
⏳ Days on Market & Seller Advantage
- Average Days on Market: 29.6 days 📅
- Sale-to-List Price Ratio: Sellers are averaging 0.529% above asking 🎉
With homes spending approximately 29.6 days on the market, the pace remains relatively brisk. Sellers are still seeing offers above list price, suggesting sustained buyer competition, particularly for well-maintained or strategically priced properties.
🧭 Key Takeaways & Investment Insights
- Market Stability with Active Buyer Interest – Despite slight declines in closed prices and price per square foot, pending sale prices are on the rise, showing ongoing demand.
- Sellers Still Have a Competitive Edge – Homes are selling quickly and often above asking, underscoring a favorable environment for sellers.
- Buyers May Find Value in New Listings – The dip in price per square foot offers potential value, especially as new inventory enters the market.
For a real estate professional, home buyer, or investor looking to make a move in Gloucester Township, NJ, this week’s report indicates a balanced yet active market. With higher-than-average closing prices on pending sales, both buyers and sellers should stay aware of these evolving trends as the market shifts heading into the end of the year.
Contact Dave Sulvetta ☎️ 856.889.8163
Search All Gloucester Township NJ Homes For Sale
Valleybrook Townhomes and Condos For Sale
Discovery - Search all Gloucester Twp NJ Homes that recently sold
#GloucesterTownshipNJ #GloucesterTwpNJ #GloucesterTownshipNJrealestatelistings #GloucesterTownshipNJRealtor